HE: Trends
There are three main types of HMI Trend graphs:
-
Trend (Data Sampler)
This is similar to the HMI Trend. It is a graphical representation of a Data Sample.
-
Live Trend
This displays a running variable integer value as a curve on a Trend graph. You may define up to 4 curves.
-
Trend (Data Sampler)
This type of Trend is the graphical representation of a Data Sample. Therefore, to implement such a Trend graph, you must:
-
Define a Data Sampler that contains at least one Feed.
Each feed will be represented as a curve on the Trend graph.
Data sampling enables you to record data, such as output values, at fixed intervals into files on an SD card. A Data Sample can contain a number of feeds.You can define multiple Data Samples.
You can also represent Data Samples as Trend graphs on the HMI screen.
Note that when you create a Data Sample, UniLogic creates a struct to enable you to control its functions.
|
Property Name
|
Definition
|
|
Start/End Sampling
|
Turn ON to begin a data recording session. Turn OFF to stop the session, close the file, and save it to SD card.
The PLC saves the file with a timestamp. The timestamp provides the date and time that the file closed (bit=OFF).
|
|
Pause Sampling
|
Turn ON to suspend the session, without closing the file. Turn Off to resume sampling.
|
|
Force Sample
|
Use this to sample data without relation to the Sampling Interval. Reset by the OS.
|
|
Clear Log
|
Turn ON to clear all of the data from the current session.
|
|
Status
|
0 = No Error
-1 = SD card not found
-2 = Reserved for internal use
-3 = Save File Error (File name may contain illegal characters)
|
|
Sampling Interval
|
Read-only. This parameter is defined in the Data Sampler Properties.
|
|
Missed Sample Bit
|
Turns ON if no Data Sample has been made during 2 Sampling Interval times. Reset by user.
|
|
Missed Sample Counter
|
Increments each time the Missed Sample Bit turns ON.
|
|
Samples Count
|
Read-only. This is the number of times the data is sampled during the session.
|
|
User Comment 1
|
The user can add comments (strings), such as Batch #; these are saved as part of the data file on the SD card.
|
|
User Comment 2
|
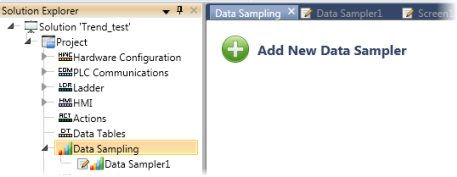
Defining a Data Sample
-
Open Data Sampling from the Solution Explorer tree.
-
Click Add New Data Sample.
-
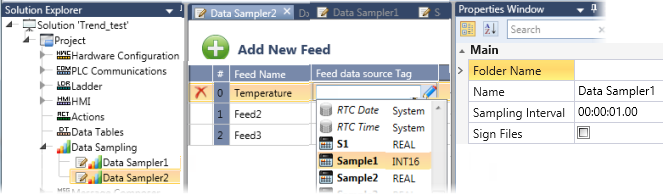
Define the  Properties for this Data Sampler.
|
Property Name
|
Definition
|
|
Folder Name
|
Click the field to assign a folder name. The application will create a folder of this name on the SD card to store the Data Sampler files.
|
|
Name
|
This is the reference name of the Data Sampler object.
|
|
Sampling Interval
|
This determines the time between data samples.
|
-
Add data Feeds: click Add New Feed, and then define the Feed Data Source Tag.
Note that you can change the default Feed Name by clicking the field and editing it.
Sampling Data
Use the members of the Data Sampler Struct: Start/End Sampling, Pause Sampling, and Force Sampling tags in your Ladder to control the sampling process.
In the image below, a Data Sampler is displayed as a Trend graph. The HMI buttons under the Trend are linked to the Data Sampler struct.
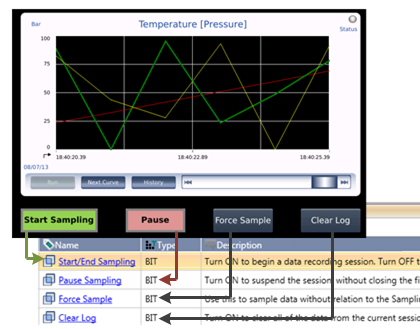
-
Place and configure a Trend widget on a display.
-
In your application, use the Data Tags within the Sampler to start, end, and pause the data feeds.
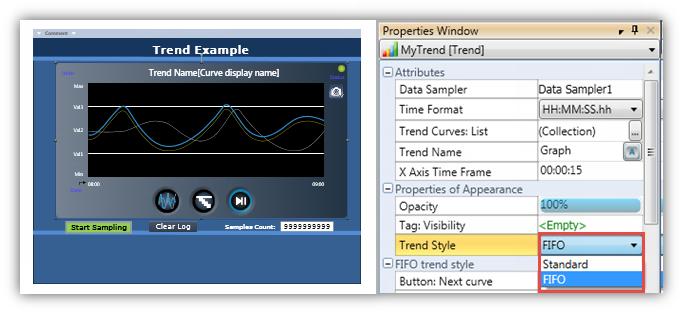
In addition to the standard Trend graph widget, where the X axis is time, you can create a graph using the XY Trend widget. This enables you to define units such as millibar or degrees for the X axis.
You can also select a Trend Style, FIFO Trend.
Configuring a Trend Widget
- Click a Trend widget in the HMI Toolbox, move your cursor to the display, and drag it to define the borders of the graph.
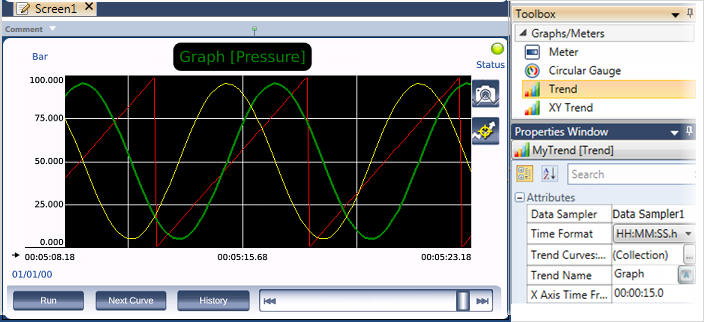
- Define the Trend Properties:
-
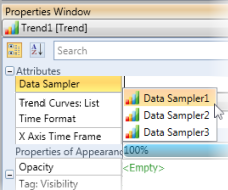
Click the Data Sampler field to select a Data Sampler to supply data Feeds for the Trend Curves.
-
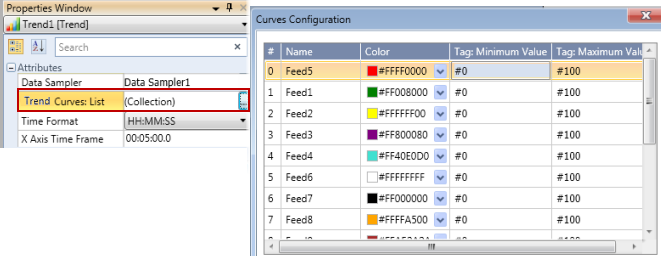
Click the Trend Curves List collection; the Curves Configuration opens.
Note that the curve Names are the names of the Data Feeds within the linked Data Sampler. You can edit a Feed name in the Data Sampler, but cannot edit them in the Curve Configuration.
You can select a color for each Curve, and define minimum and maximum values.
-
Standard Trend: select a Time Format, and set the time frame on the x-axis.
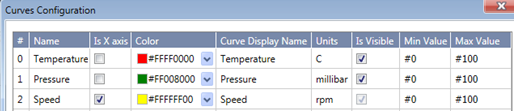
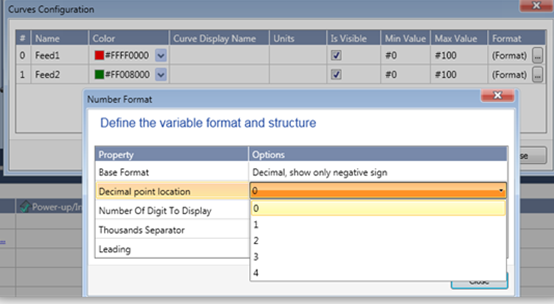
XY Trend: Use the additional Curve properties to set the number format for the y-axis.
-
When you download the application to the controller, the Trend widget contains elements and buttons that control the display of the Trend graph.
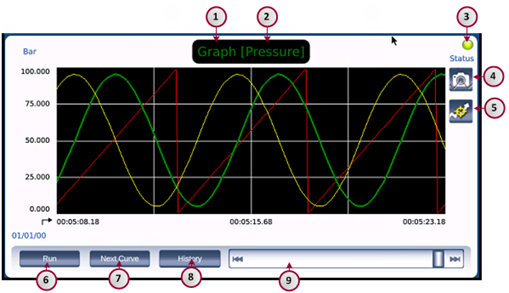
The table below relates to the elements in the widget.
|
Element
|
|
Function
|
|
1
|
Trend Name
|
Inherited from the Trend Property: Name of Element
|
|
2
|
Curve Name
|
The name of the currently highlighted Curve. This means that the curve line is thicker and brighter than the other curves on the screen.
|
|
3
|
Sampler Status
|
This simulates a status LED. It is green when the Data Sampler is active.
|
|
4
|
Screenshot
|
Press this while the Trend is running in order to take a screenshot and save it to the SD Card.
|
|
5
|
View Data Point
|
Press this to view the sampling value & time while the Trend view is in Stop mode
|
|
6
|
Run/Stop button
|
Press Run to start or stop the view of the running Trend Graph. (This does not stop the sampling recording).
|
|
7
|
Next Curve
|
When the Trend begins to run, the first curve in the Trend Curves Collection list is highlighted on the screen. Use the Next Curve button to jump to the next Curve.
|
|
8
|
History
|
Press History to display a list of saved Data Sampler files.
|
|
9
|
Slider bar
|
When viewing History, use the Slider to move forward and back in the Trend.
|
Note that on the HMI, you can press the button in the top left corner to hide the buttons and increase the viewing space, and press again to display them.
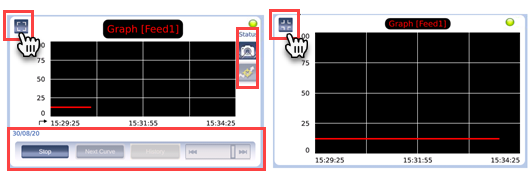
In the image below, a Data Sampler is displayed as a Trend graph. The HMI buttons under the Trend are linked to the Data Sampler struct.
View Data Values
Your users can touch the curve and view the sampling value & time while the Trend view is in Stop mode. Touch View Data, then touch the active curve to display two yellow lines that intersect at the touch point.
Use the arrows to move the point along the curve.
When the user views a Standard Trend, the user must stop the sampling, and select the file to view.
The FIFO Trend allows the user to view the last Trend file, and then to page through the files in chronological order.
If the history contains 15 files, where File_1 is the oldest and the user is currently viewing the active file, clicking the center button will enter History Mode. In History Mode, arrows allow the user to page back to File_14, 13, etc. Within a particular file, the user can use the Slider to navigate back and forth in the file.
A live Trend displays a running variable integer value as a curve on a Trend graph. You may define up to 4 curves.
Unlike Trends derived from Data Sampling:
-
Live Trend values are not drawn from a Data Sampler.
-
Live Trends do not store any values, log any data, or create any files.
They are convenient for tasks such as representing temperature values, where only monitoring is needed and logging is not required.
In addition to the standard Trend graph widget, where the X axis is time, you can create a graph using the XY Trend widget. This enables you to define units such as millibar or degrees for the X axis.
You can also select a Trend Style, FIFO Trend.
Configuring a Trend Widget
- Click a Trend widget in the HMI Toolbox, move your cursor to the display, and drag it to define the borders of the graph.

- Define the Trend Properties:
-
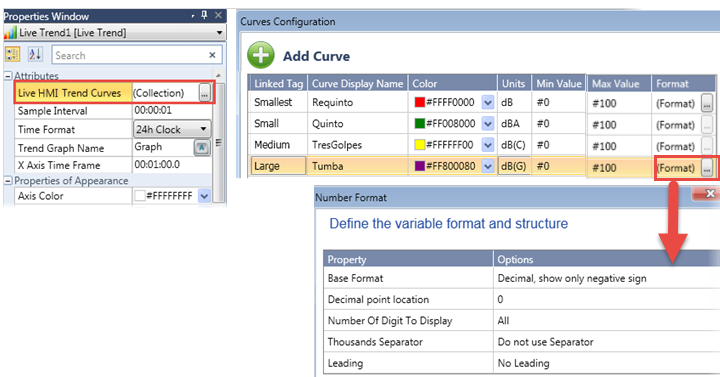
Click the Live Trend Curves List collection to open the Curves Configuration.
-
Link the tags that feed the Curves.
-
You can select a color for each Curve, define minimum and maximum values, and set the number format.
|
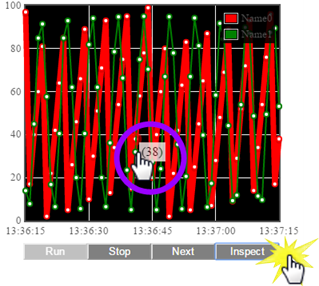
When the Live Trend runs, pressing Inspect displays sampling points.
You can touch a point to view its value.
|
|
Similar to a Live Trend, a Cyclic Trend displays a running variable integer value as a curve on a Trend graph.
-
Live Trend values are not drawn from a Data Sampler.
-
Live Trends do not store any values, log any data, or create any files.
The difference is that the Cyclic Trend shows only a specific time frame of that running value; for example, the last 10 seconds.
Main Graphs
i. UniStream will allow presentation of three trends (Live Trends) in one HMI screen, each trend will be able to present only one sampled value. Each sampled value will be available in different color.
ii. The X Axis (time, seconds) will be able for change from 11 to 22 seconds upon user request during run time.
iii. There will be an option to change each trend color programmatically (ladder element from Ladder logic) to support presentation or random breath.
iv. The main trends will only present live data and no historical data will be supported in that screen. Historical data can be presented on separate menu screen.
v. Auto-scale functionality will remain as currently existing today.
Related Topics
Data Tables
Creating a Data Table
Entering/Editing Data Table Values
Data Sampling
WE: Web Trends
HE: Data Table Widget
WE: Web Data Table