Use the Stacked Chart widget to display a single column composed of up to five individual values.
Each value is represented as a colored segment, referred to as a Legend.
Unlike a standard bar chart, the segments are stacked: each value begins where the previous one ends, creating a single accumulated total, ideal for visualizing the composition of a single total, such as energy consumption by source or by tariff.
|
Stacked Chart Attributes |
|
|
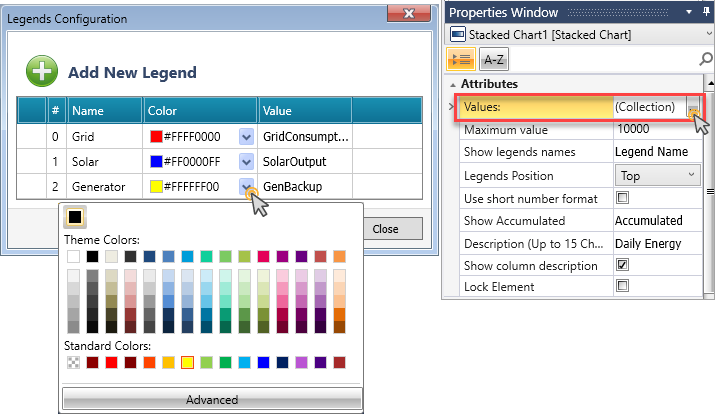
Values |
Values enable configuring up to five legends for the stacked chart. To configure the Legends:
|
|
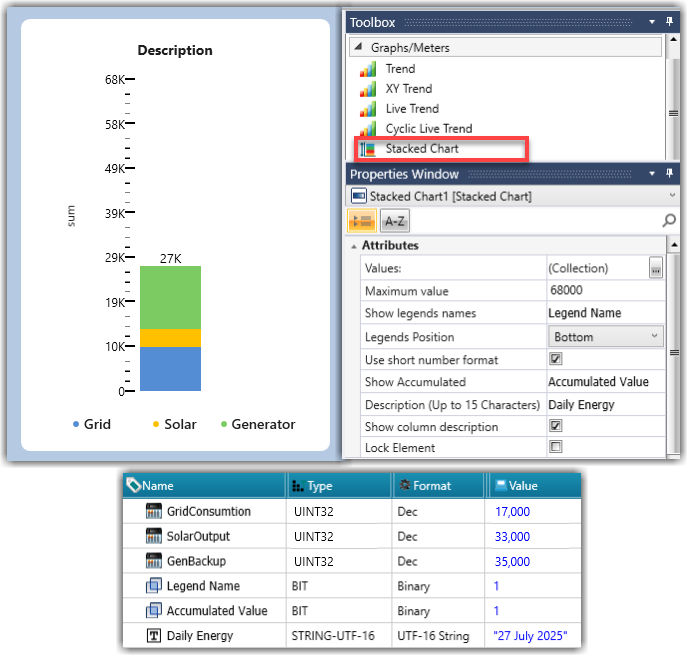
Maximum value |
Define the upper limit of the stacked column's vertical scale. |
| Tag: Show Legends Names | Link a bit; this bit controls whether legend names appear alongside the column segments. |
|
Legends Position |
Select the location of the legend names relative to the column. |
|
Use Short Number Format |
Enable this option to display large values in compact form (e.g., 1200 -> 1.2K) |
|
Tag: Show Accumulated |
Link a bit; this bit controls whether the widget displays the total accumulated value of all segments. |
|
Tag: Description |
Link a string tag (up to 15 characters) |
|
Show Column Description |
This is checked by default; uncheck if you wish to hide the column description. |
|
Lock Element |
Check to prevent any adjustments or changes to the element's configuration. |