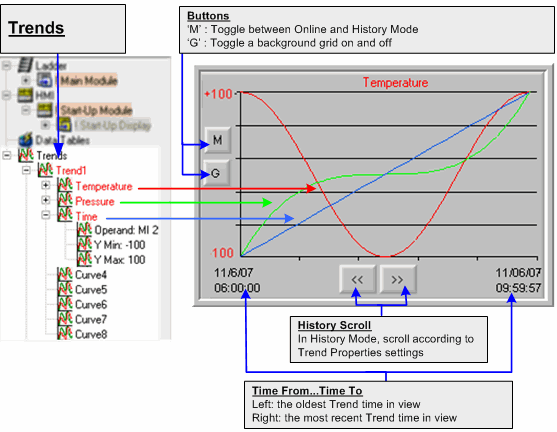
A Trend graph displays a dynamically changing value graph that tracks a single, dynamic value such as a temperature value, as a curve on the Vision screen.
|
Note |
Trends (Legacy) Function Block If your project is configured to Standard Vision controllers that do not support HMI object Trend graphs, the Trend objects will not be displayed in the Project Navigation Window. In these models, use the Trends (Legacy) Function Block. |
Trends are displayed in the Project Navigation Window. The number of Trends and Curves that can be displayed depends on controller model:
V560/ ERROR: Variable (V570V1040V1210) is undefined.
Up to 8 Trends, each displaying up to 8 Curves
V130
Up to 4 Trends, each displaying up to 2 Curves
Each Curve may be linked to a different register, and can be configured to a different color.
Trends have a default touch property that causes a touched Curve to be brought forward. In the following figure, the Temperature curve is in front.
Touch the Mode button to toggle between:
Run Mode:
Shows the Trend being drawn in real-time
History Mode:
Stops the Trend, displays History Scroll buttons; touch these to scroll back and forth between different Trend graph sections

V130
Since the V130 does not offer a touch screen, you use the Keypad arrow buttons to enter and navigate through History Mode
|
Enter History Mode |
Up arrow |
|
Exit to Online Mode |
Down arrow |
|
Scroll through History |
Left and right arrows |
Define a Trend:
Right-click the desired Trend to open and set Trend Properties.
Define Curves
Right-click the desired Curve to open and set Curve Properties.
Once you configure a Trend and at least a single Curve, you can place the graph in different HMI displays and set specific properties for the Trend in that display, such as the Trend background color and Curve colors.
Place a Trend Graph in an HMI Display
Start and stop the Trend as shown below.

To learn more about Trends, check Trends - Color Vision.vlp in the Help> Examples.