Bar and Shape graphs can be used to show how values progress. You can use them together with other Display elements to help operators track system progress and status.
This is a sample of an HMI Display and how its elements can look on the controller's LCD.
|
Note ♦ |
Vision controllers also support Trend graphs |
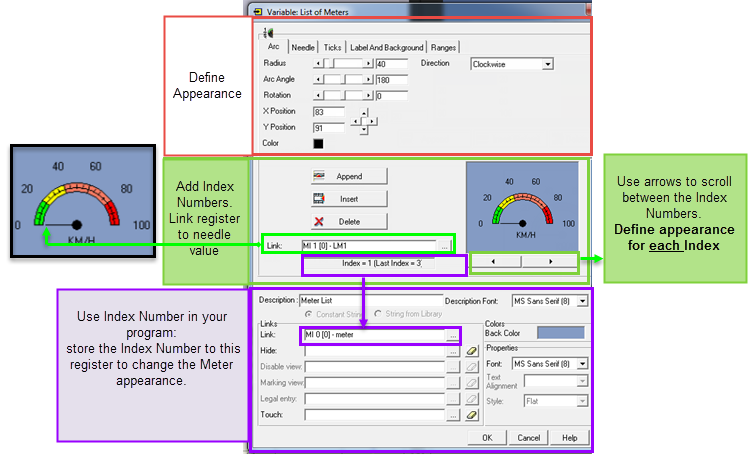
On the HMI toolbar, click on a Graph icon; then drag the cursor across the controller screen to create the graph object.
Select the appropriate options. Graph options vary according to the Vision Division and HMI Display type.
V290 color, V570