HE: Trends
There are three main types of HMI Trend graphs:
-
Trend (Data Sampler)
This is similar to the HMI Trend. It is a graphical representation of a Data Sample.
-
Live Trend
This displays a running variable integer value as a curve on a Trend graph. You may define up to 8 curves.
-
HE: Trends (Cyclic)
Similar to a Live Trend, a Cyclic Trend displays a running variable integer value as a curve on a Trend graph.
Trend (Data Sampler)
This type of Trend is the graphical representation of a Data Sample. Therefore, to implement such a Trend graph, you must:
-
Define a Data Sampler that contains at least one Feed.
Each feed will be represented as a curve on the Trend graph.
-
Place and configure a Trend widget on a display.
-
In your application, use the Data Tags within the Sampler to start, end, and pause the data feeds.
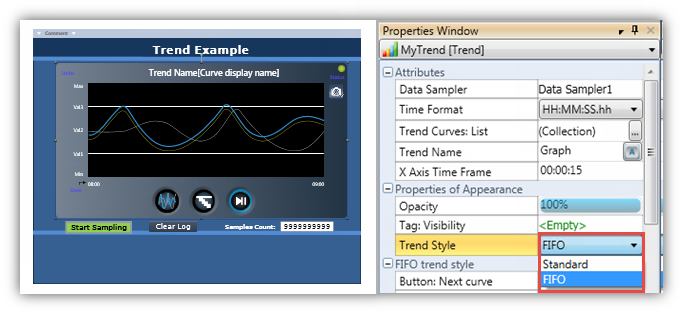
In addition to the standard Trend graph widget, where the X axis is time, you can create a graph using the XY Trend widget. This enables you to define units such as millibar or degrees for the X axis.
You can also select a Trend Style, FIFO Trend.
Configuring a Trend Widget
-
Click a Trend widget in the HMI Toolbox, move your cursor to the display, and drag it to define the borders of the graph.
-
Define the Trend Properties:
-
Click the Data Sampler field to select a Data Sampler to supply data Feeds for the Trend Curves.

-
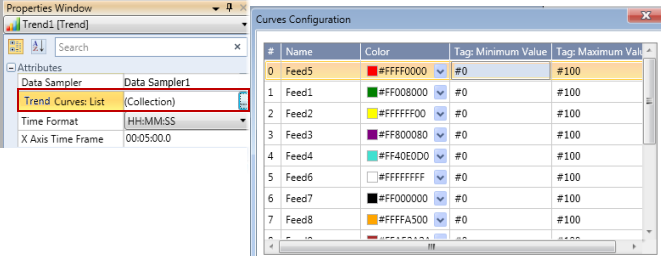
Click the Trend Curves List collection; the Curves Configuration opens.
Note that the curve Names are the names of the Data Feeds within the linked Data Sampler. You can edit a Feed name in the Data Sampler, but cannot edit them in the Curve Configuration.
You can select a color for each Curve, and define minimum and maximum values.
-
Standard Trend: select a Time Format, and set the time frame on the x-axis.

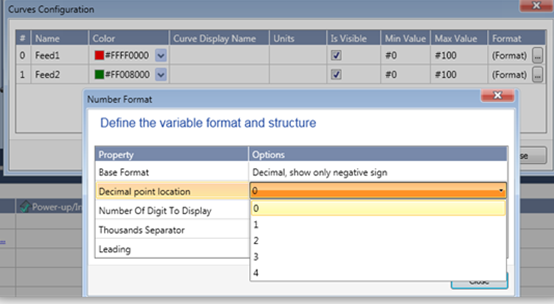
XY Trend: Use the additional Curve properties to set the number format for the y-axis.
-
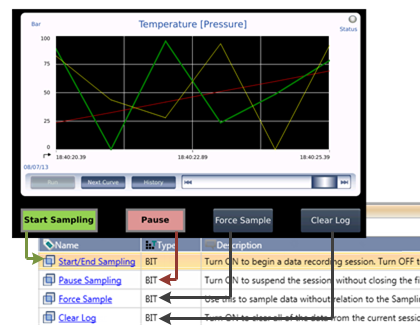
When you download the application to the controller, the Trend widget contains elements and buttons that control the display of the Trend graph.

The table below relates to the elements in the widget.
|
|
Element
|
Function
|
|
1
|
Trend Name
|
Inherited from the Trend Property: Name of Element
|
|
2
|
Curve Name
|
The name of the currently highlighted Curve. This means that the curve line is thicker and brighter than the other curves on the screen.
|
|
3
|
Sampler Status
|
This simulates a status LED. It is green when the Data Sampler is active.
|
|
4
|
Screenshot
|
Press this while the Trend is running in order to take a screenshot and save it to the SD Card.
|
|
5
|
View Data Point
|
Press this to view the sampling value & time while the Trend view is in Stop mode
|
|
6
|
Run/Stop button
|
Press Run to start or stop the view of the running Trend Graph. (This does not stop the sampling recording).
|
|
7
|
Next Curve
|
When the Trend begins to run, the first curve in the Trend Curves Collection list is highlighted on the screen. Use the Next Curve button to jump to the next Curve.
|
|
8
|
History
|
Press History to display a list of saved Data Sampler files.
|
|
9
|
Slider bar
|
When viewing History, use the Slider to move forward and back in the Trend.
|
Note that on the HMI, you can press the button in the top left corner to hide the buttons and increase the viewing space, and press again to display them.

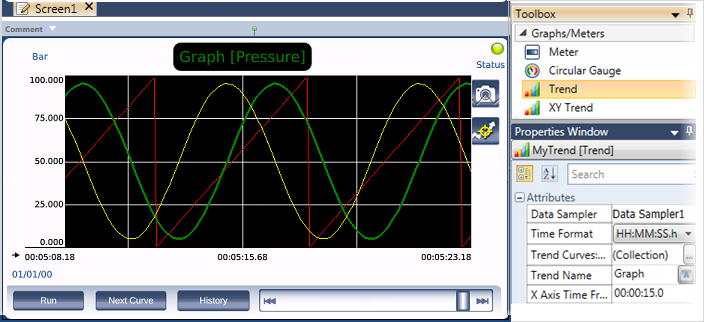
In the image below, a Data Sampler is displayed as a Trend graph. The HMI buttons under the Trend are linked to the Data Sampler struct.
View Data Values
Your users can touch the curve and view the sampling value & time while the Trend view is in Stop mode. Touch View Data, then touch the active curve to display two yellow lines that intersect at the touch point.
Use the arrows to move the point along the curve.

When the user views a Standard Trend, the user must stop the sampling, and select the file to view.
The FIFO Trend allows the user to view the last Trend file, and then to page through the files in chronological order.
If the history contains 15 files, where File_1 is the oldest and the user is currently viewing the active file, clicking the center button will enter History Mode. In History Mode, arrows allow the user to page back to File_14, 13, etc. Within a particular file, the user can use the Slider to navigate back and forth in the file.
A live Trend displays a running variable integer value as a curve on a Trend graph. You may define up to 8 curves.
Unlike Trends derived from Data Sampling:
-
Live Trend values are not drawn from a Data Sampler.
-
Live Trends do not store any values, log any data, or create any files.
They are convenient for tasks such as representing temperature values, where only monitoring is needed and logging is not required.
In addition to the standard Trend graph widget, where the X axis is time, you can create a graph using the XY Trend widget. This enables you to define units such as millibar or degrees for the X axis.
You can also select a Trend Style, FIFO Trend.
Configuring a Trend Widget
-
Click a Trend widget in the HMI Toolbox, move your cursor to the display, and drag it to define the borders of the graph.

-
Define the Trend Properties:
-
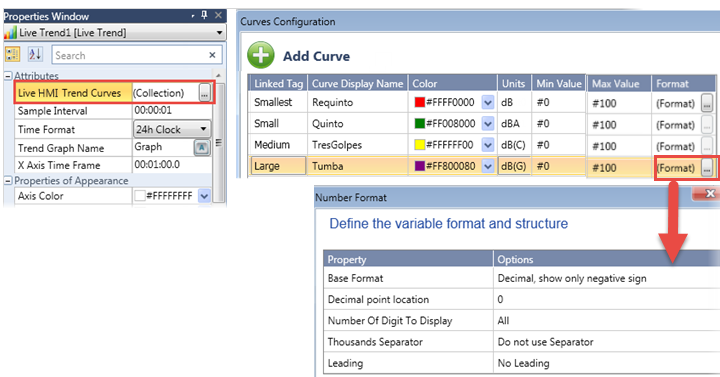
Click the Live Trend Curves List collection to open the Curves Configuration.
-
Link the tags that feed the Curves.
-
You can select a color for each Curve, define minimum and maximum values, and set the number format.
|
When the Live Trend runs, pressing Inspect displays sampling points.
You can touch a point to view its value.
|

|
HE: Trends (Cyclic)
Similar to a Live Trend, a Cyclic Live Trend displays a running integer value as a curve on a Trend graph.
However, the key difference is that a Cyclic Live Trend shows only a specific time frame of the running value, such as the last 10 seconds.
Unlike Trends derived from Data Sampling:
-
Cyclic Live Trend values are not drawn from a Data Sampler.
-
Cyclic Live Trends do not store any values, log any data, or create any files.
They are convenient for tasks such as representing temperature values, where they can provide operators with immediate feedback on the status and performance of various processes.
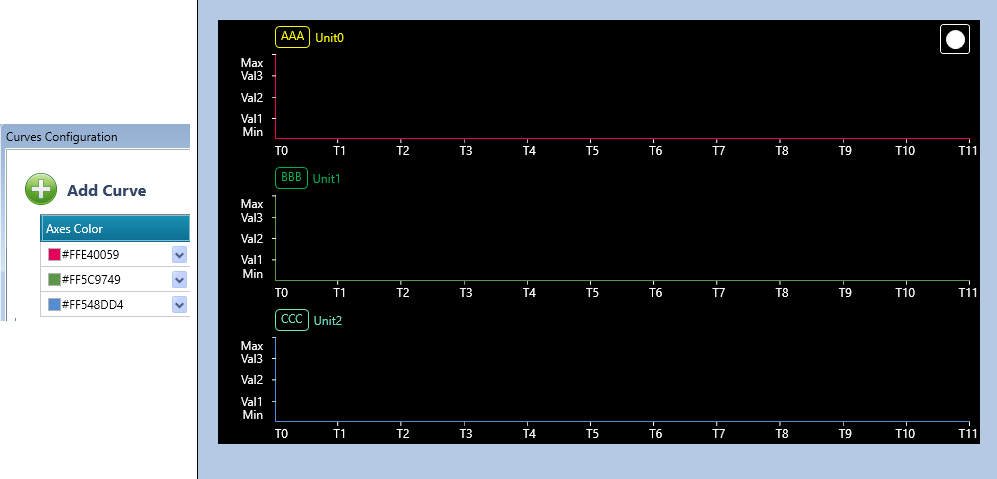
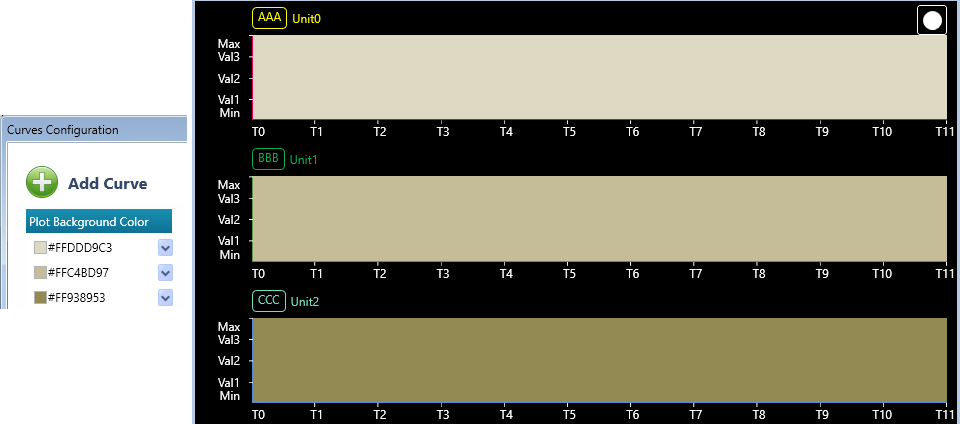
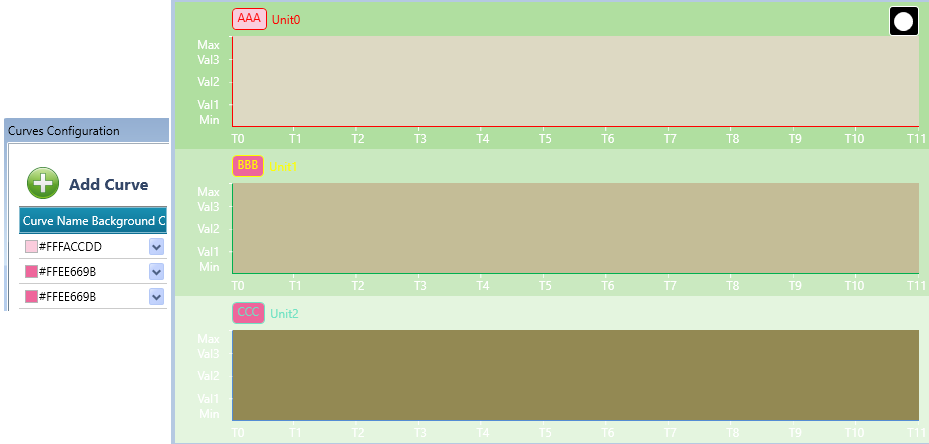
The Cyclic Live Trend allows the presentation of up to three live trends on a single HMI screen, with each trend presenting only one sampled value. Each of these sampled values may be displayed in a different color for easy differentiation.
Configuring a Cyclic Live Trend Widget
-
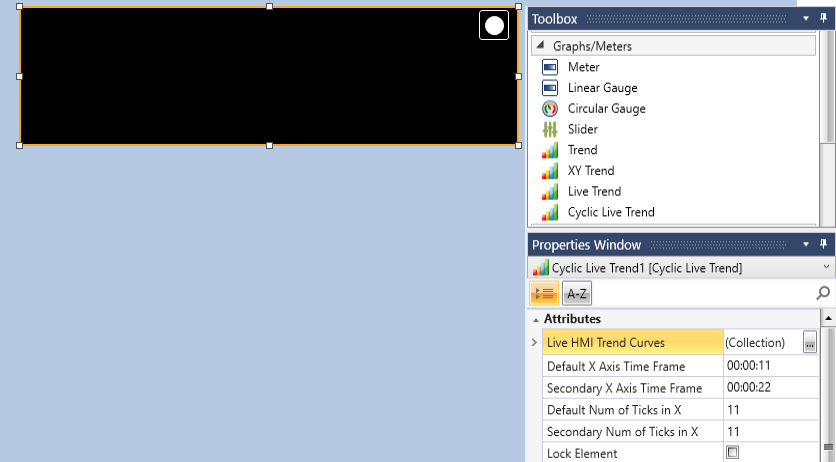
Click a Cyclic Live Trend widget in the HMI Toolbox, move your cursor to the display, and drag it to define the borders of the graph.
-
Define the Cyclic Live Trend Properties:
-
Click the Live HMI Trend Curves list collection to open the Curves Configuration.
-
Link the tags that feed the Curves.
-
You can define the Curve Color via an ASCII tag in two ways:
- Fixed Color per Curve - Assign a specific color name tag (e.g., red, yellow, blue) to each curve during configuration.The curve will always appear in the assigned color.
- Dynamic Color - Use a tag (e.g., Color) to set the curve color dynamically at runtime. All curves linked to this tag will share the same color while displaying different values.
-
You can define minimum and maximum values, set the name and Unit colors, and define the colors for the below:
-
Default X Axis Time Frame - Set the initial time window displayed on the X Axis when the Trend is loaded. If set to 11 seconds, the graph will show data for the last 11 seconds by default.
-
Secondary X Axis Time Frame - Provides an alternative time window that you can switch to during runtime. If set to 22 seconds, users can adjust the trend graph to display data for the last 22 seconds.
-
Default Num of Ticks in X - Specifies the number of tick marks (divisions) along the X-axis for the default time frame.
-
Secondary Num of Ticks in X - Specifies the number of tick marks (divisions) along the X-axis for the secondary time frame.
When the Cyclic Live Trend runs, press the  to switch between the defined time trends.
Related Topics
Data Tables
Creating a Data Table
Entering/Editing Data Table Values
Data Sampling
WE: Web Trends
HE: Data Table Widget
WE: Web Data Table