LF: AOI Compare Image (B10 models only)
UniStream's AOI functionality supports shape and color recognition. The AOI Compare Image Ladder functions enable you to:
-
Compare two images stored on the controller's SD card
-
Automatically photograph an image with a connected USB Camera, and compare it to an image stored on the controller's SD card
You can select the algorithm family and specific algorithm that the function will use to compare them. Algorithm families include:
|
Notes
|
-
These functions are relevant for B10 models only.
-
The images that are taken by the camera will be at 640x480 resolution.
-
Place the Optimal Image, the image to which the comparison is made, in the SD card folder: “/SD/Media/Camera”.
-
Functions marked 'Debug' save the resultant AOI-compared image in the following SD card folder .../Media/Camera/AOI, in the following format FILENAME_TIMESTAMP.jpg.
|
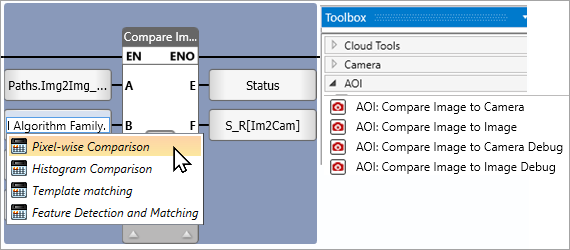
AOI Ladder Functions
Certain Ladder Function parameter options change to support your selected algorithm.
Compare Image to Camera / Compare Image to Camera Debug
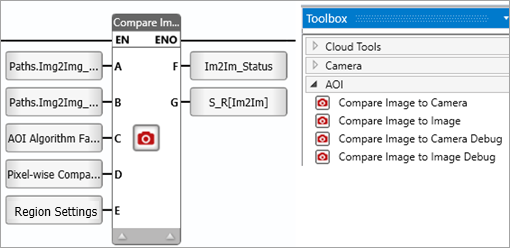
These functions compare images from a connected USB Camera to an image stored on the controller's SD card.
|
|
|
|
|
A
|
Optimal image
|
Link a tag to provide the stored image path on the SD card, relative to /Media/Camera/
This is the image that is compared to the current camera image.
|
|
C
|
Algorithm Family
|
This selection will determine the algorithm options available in the next parameter.
Click to select an Algorithm family:
-
Pixel-wise Comparison
Compares two images by comparing the values of their corresponding pixels, where each pixel represents the difference or similarity between the corresponding pixels in the input images. (0%-100%)
This method can help you find differences between two images at the pixel level.
-
Histogram Comparison
Compares the RGB histograms of two images, determining the similarity of their color distributions. Similarity is calculated between the two input
images based on their RGB histograms.
This method can help you find similarities between two images based on their color distributions.
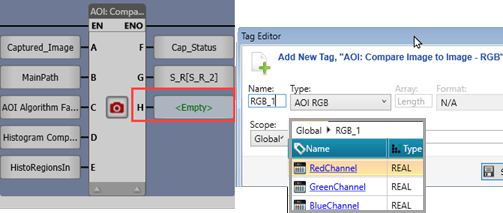
*Selecting Histogram will add an output parameter: RGB, which is a struct containing three REAL tags for the red, green, an blue channel values.
-
Template matching
Locates similarities: small parts of an image that match a template image. Can be used to find objects within an image or to find similarities between two images, returning a correlation score that indicates how well the template matches the larger image at each location.
Note that the second image can be smaller.
*Selecting Template will add an output parameter: Rectangle Coordinates, which is a struct containing three tags for the x & y coordinates where the section matching the template was located.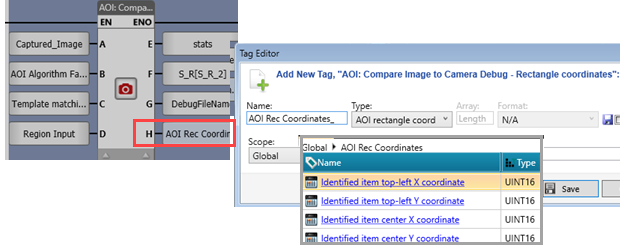
-
Feature Detection and Matching
Finds similarities between two images by detecting and matching distinctive features in both images, even if they have different scales, rotations, or perspectives.
A feature is a distinctive part of an image that can be detected and matched. Common feature types include corners, edges, and blobs;
the function returns a matching score, where closer to 0 indicates a closer match between images.
The second image can be smaller.
|
| c |
Algorithm to Use
|
Selecting the Algorithm family enables the options relevant for that family:
-
Pixel-wise Comparison
-Pixel-wise Comparison
-
Histogram Comparison
-Correlation
-Chi-Square
-Intersection
-Bhattacharyya distance
-
Template matching
-TM_SQDIFF
-TM_SQDIFF_NORMED
-TM_CCORR
-TM_CCORR_NORMED
-TM_CCOEFF
-TM_CCOEFF_NORMED
-
Feature Detection and Matching
-Brute-Force Matching with ORB Descriptors
-FLANN based Matcher with ORB Descriptors
|
|
D
|
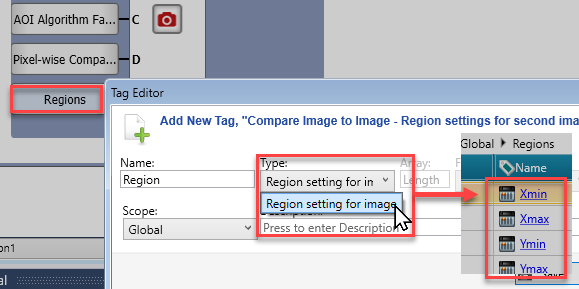
Region settings
|
Sets the locations of the pixels that determine the region of the image to be compared to the optimal image.
If you do not use this parameter, the entire image is compared.
|
|
E
|
Status
|
0 = Success
1 = CPU in progress
2 = Panel in progress
-1 = Internal Error
-2 = File doesn't exist
-3 = No camera detected
-4 = Images have different or incorrect sizes
-5 = Not enough matches (Feature matching)
-6 = Different number of columns of the images (Feature matching)
|
|
F
|
Similarity Rate
|
This is the percentage that expresses how much the Optimal image stored on the SD card is similar to the image taken by the camera, where a value of 100 is returned if the images are identical.
|
|
G
|
Debug Only:
Name for AOI
Image result
|
Assign a name to be included as a prefix to the image timestamp.
|
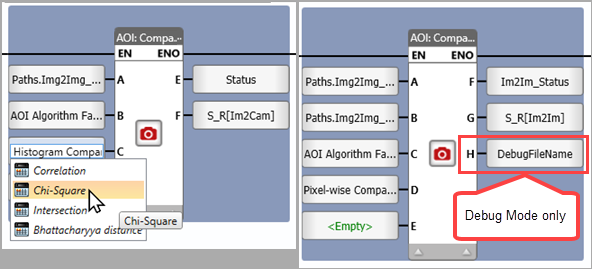
AOI: Compare Image to Image /Image to Image Debug
Compare Image to Image and Compare Image to Image Debug both compare two images stored on the SD card.
Compare Image to Image Debug saves the resultant AOI-compared image in the following SD card folder .../Media/Camera/AOI.
Debug functions offer an additional parameter that enables you to assign a name, which is automatically included in the filename along with a timestamp: FIlENAME_TIMESTAMP.jpg.
Place both images in the SD card folder: “/SD/Media/Camera”.
|
|
|
|
|
A
|
Optimal image
|
Optimal imagepath, relative to /Media/Camera/
|
|
B
|
Second Image
|
Second image path, relative to /Media/Camera/
|
|
C
|
Algorithm Family
|
his selection will determine the algorithm options available in the next parameter.
Click to select an Algorithm family:
-
Pixel-wise Comparison
Compares two images by comparing the values of their corresponding pixels, where each pixel represents the difference or similarity between the corresponding pixels in the input images. (0%-100%)
This method can help you find differences between two images at the pixel level.
-
Histogram Comparison
Compares the RGB histograms of two images, determining the similarity of their color distributions. Similarity is calculated between the two input
images based on their RGB histograms.
This method can help you find similarities between two images based on their color distributions.
*Selecting Histogram will add an output parameter: RGB, which is a struct containing three REAL tags for the red, green, an blue channel values. 
-
Template matching
Locates similarities: small parts of an image that match a template image. Can be used to find objects within an image or to find similarities between two images, returning a correlation score that indicates how well the template matches the larger image at each location.
Note that the second image can be smaller.
*Selecting Template will add an output parameter: Rectangle Coordinates, which is a struct containing three tags for the x & y coordinates where the section matching the template was located.
-
Feature Detection and Matching
Finds similarities between two images by detecting and matching distinctive features in both images, even if they have different scales, rotations, or perspectives.
A feature is a distinctive part of an image that can be detected and matched. Common feature types include corners, edges, and blobs;
the function returns a matching score, where closer to 0 indicates a closer match between images.
The second image can be smaller.
|
|
D
|
Algorithm to Use
|
Selecting the Algorithm family enables the options relevant for that family:
-
Pixel-wise Comparison
-Pixel-wise Comparison
-
Histogram Comparison
-Correlation
-Chi-Square
-Intersection
-Bhattacharyya distance
-
Template matching
-TM_SQDIFF
-TM_SQDIFF_NORMED
-TM_CCORR
-TM_CCORR_NORMED
-TM_CCOEFF
-TM_CCOEFF_NORMED
-
Feature Detection and Matching
-Brute-Force Matching with ORB Descriptors
-FLANN based Matcher with ORB Descriptors
|
|
E
|
Region settings
for second image
|
Sets the locations of the pixels that determine the region of the second image to be compared to the optimal image.
If you do not use this parameter, the entire image is compared.

|
|
F
|
Status
|
0 = Success
1 = CPU in progress
2 = Panel in progress
-1 = Internal Error
-2 = File doesn't exist
-3 = No camera detected
-4 = Images have different or incorrect sizes
-5 = Not enough matches (Feature matching)
-6 = Different number of columns of the images (Feature matching)
|
|
G
|
Similarity Rate
|
This is the percentage that expresses how much the Optimal image stored on the SD card is similar to the image taken by the camera, where a value of 100 is returned if the images are identical.
|
|
H
|
Debug Only:
Name for AOI Image result
|
Assign a name to be included as a prefix to the image timestamp.
|
AOI Algorithms and related parameters
Pixel-wise Comparison
Compares two images by comparing the values of their corresponding pixels.
It will return an image where each pixel represents the difference or similarity between the corresponding pixels in the input images. (0%-100%)
This method can help you find differences between two images at the pixel level.
The two images must have the same pixel ratio of 640x480.
Histogram Comparison
Measures the similarity between two images based on their color distributions. A histogram represents the distribution of pixel values in an image by counting the number of pixels that have each possible value. By comparing the histograms of two images, you can determine how similar their color distributions are based on their RGB histograms.
This method can help you find similarities between two images based on their color distributions.
The two images must have the same pixel ratio of 640x480.
Method Options
- 0: Correlation: Computes the correlation between the two histograms.
The Similarity value returned is between -1 and 1. A value of 1 indicates a perfect positive linear relationship between the histograms, a value of -1 indicates a perfect negative linear relationship, and a value of 0 indicates no linear relationship.
- 1: Chi-Square: Applies the Chi-Squared distance to the histograms.
The Similarity value returned is always non-negative. A smaller value indicates a better fit between the histograms.
- 2: Intersection: Calculates the intersection between two histograms.
The Similarity value returned is always non-negative. A larger value indicates more overlap between the histograms.
- 3: Bhattacharyya distance: Bhattacharyya distance, used to measure the “overlap” between the two histograms.
The Similarity value returned is always non-negative. A smaller value indicates more similarity between the histograms.
Template matching
This image processing technique finds small parts of an image that match a template image. It can be used to find objects within an image or to find similarities between two images.
This function returns a correlation score that indicates how well the template matches the larger image at each location.
You can use this method to find similarities between two images by using one image as the template and the other as the larger image.
The second image can be smaller.
Method Options
- 0: TM_SQDIFF: Calculates the squared difference between the template and input image.
The maximum Similarity score is always non-negative. A smaller value indicates a better match between the template and input image.
- 1: TM_SQDIFF_NORMED: Calculates the normalized squared difference between the template and input image.
The maximum Similarity score is always non-negative. A smaller value indicates a better match between the template and input image.
- 2: TM_CCORR: Calculates the cross-correlation between the template and input image.
The range of possible values for the maximum similarity score depends on the size of the template and input image.
- 3: TM_CCORR_NORMED: Calculates the normalized cross-correlation between the template and input image
The maximum Similarity score is between -1 and 1.
A value of 1 indicates a perfect match between the template and input image, a value of -1 indicates a perfect mismatch, and a value of 0 indicates no correlation.
- 4: TM_CCOEFF: Calculates the correlation coefficient between the template and input image.
The range of possible values for the maximum Similarity score depends on the size of the template and input image.
- 5: TM_CCOEFF_NORMED: Calculates the normalized correlation coefficient between the template and input image.
The maximum Similarity score is between -1 and 1. A value of 1 indicates a perfect match between the template and input image, a value of -1 indicates a perfect mismatch, and a value of 0 indicates no correlation.
This method usually returns the best results, and should be the first one tried.
Each method has its own strengths and weaknesses and may perform better in certain situations. It’s a good idea to experiment with different methods to see which one works best for your specific use case.
|
Notes
|
-
When using the TM_SQDIFF/TM_CCORR/TM_CCOEFF method with matchTemplate, the result is not normalized and the values can be very large. This method calculates the cross-correlation between the template and the image patches, so a larger value indicates a better match. However, this method does not take into account the mean and standard deviation of the template and image patches, so it may not always give the expected results.If you want to use a method that normalizes the result and takes into account the mean and standard deviation of the template and image patches, use one of the normalized methods: TM_SQDIFF_NORMED, TM_CCORR_NORMED, or TM_CCOEFF_NORMED. These methods normalize the result and take into account the mean and standard deviation of the template and image patches, which can help improve the accuracy of the match.
- If your template and image have similar brightness and contrast, you can use the TM_SQDIFF or TM_SQDIFF_NORMED methods. These methods calculate the squared difference between the template and the image patches, so a smaller value indicates a better match.
- If your template and image have different brightness and contrast, you can use the TM_CCOEFF or TM_CCOEFF_NORMED methods. These methods calculate the correlation coefficient between the template and the image patches, taking into account the mean and standard deviation of the template and image patches.
- If you want to find the template in the image regardless of its brightness and contrast, you can use the TM_CCORR or TM_CCORR_NORMED methods. These methods calculate the cross-correlation between the template and the image patches, so a larger value indicates a better match.
-
TM_SQDIFF is Sum of Square Difference (SSD). It's fast but results depend on overall intensity
-
TM_CCORR (sometimes called Cross Correlation) is SSD under the circumstance that the sum of portion of the image under matching is constant when the template moves over the image or simply the image is almost constant. Note that this method greatly relies on overall intensity. This can result in false detections when using a perfect template, if the image has a great variation in intensity.
-
TM_CCOEFF (often called Cross Correlation Coefficient) is correlation coefficient. It considers the mean of template and the mean of the image so that the matching is quite robust to local variation. This method can give the most accurate result, but is slower than others.
In general, it’s a good idea to try different methods and see which one gives the best results for your specific use case. You can also try using multiple methods and combining their results to improve the accuracy of the match.
|
Feature Detection and Matching
This method finds similarities between two images by detecting and matching distinctive features in both images. A feature is a distinctive part of an image that can be reliably detected and matched across different images. Common types of features include corners, edges, and blobs.
The Similarity value is a matching score, where closer to 0 indicates a better match.
This method can help you find similarities between two images even if they have different scales, rotations, or perspectives.
The second image can be smaller.
Method Options
- 0: Brute-Force Matching with ORB Descriptors: It takes the descriptor of one feature in first set and is matched with all other features in second set using some distance calculation. And the closest one is returned.
- 1: FLANN based Matcher with ORB Descriptors: FLANN stands for Fast Library for Approximate Nearest Neighbors. It contains a collection of algorithms optimized for fast nearest neighbor search in large datasets and for high dimensional features. It works faster than BFMatcher for large datasets.
Related Topics
LF: Camera Elements


