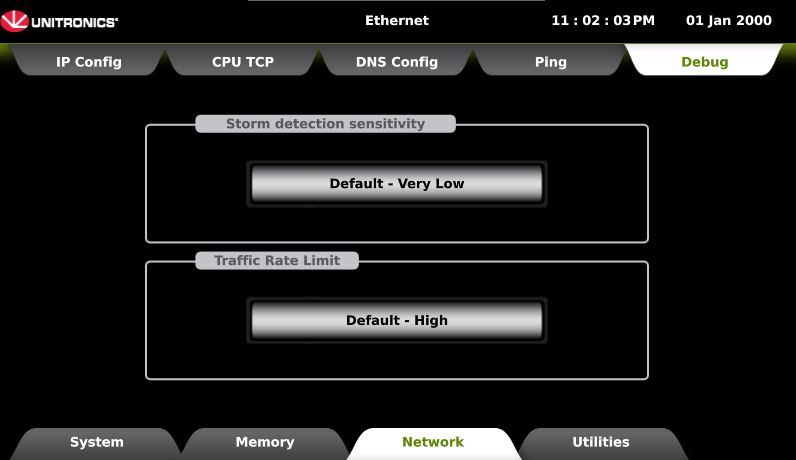
The Debug tab in UniApps provides tools for monitoring and diagnosing abnormal network behavior. It includes two displays that support network troubleshooting and protection against excessive traffic:
-
Storm Detection Sensitivity
-
Traffic Rate Limit
These displays allow users to control how the controller detects network storms and how network traffic is limited under high-load conditions.
Storm Detection Sensitivity
This feature includes system tags for Storm in the struct System->Execution:
-
Storm Count 1: Storm counter, number of times a storm caused the port to close for 1 second. UINT32
-
Storm Count 30: Storm counter, number of times a storm caused the port to close for 30 seconds. UINT32
These tags will be updated every 2.5 seconds, regardless of whether or not a storm has recurred.
When there is a storm it will be written to the System Error struct:
-
The error code is 16. (Hex: 00000010)
-
Date and time of the storm.
-
Error string: Storm detected; counter is <x> when x is the internal storm counter 1 to 4.
Storm Diagnostic Information
To assist with troubleshooting, the system records information about the network traffic present immediately before a storm is detected. All diagnostic fields are populated at the moment the storm is identified.
This feature includes system tags for debugging in the struct System>Storm Detection:
-
Last packet MAC address: Mac address of the last packet received
-
Last packet IP address: IP address of the last packet received
-
Last packet IP Packet Type: Packet type (ARP, Ping, TCP, or UDP)
-
Last Packet Raw Data: First 100 bytes of the packet
Traffic Rate Limit
Traffic Rate Limit defines the maximum allowable network traffic rate before filtering and rate-limiting mechanisms are applied. This setting controls how aggressively network traffic is restricted to prevent congestion and storm conditions.
Traffic rate limiting applies to broadcast, ARP, and unknown unicast/multicast traffic and is enforced using predefined protection profiles.
Traffic Rate Limit settings apply per network interface. On controllers with multiple Ethernet ports, protection is enforced independently for each port using the selected protection level.
Note that changing the default protection level requires a controller reboot before changes take effect.
Protection Levels:
-
Built-in Controllers; protection for both Bucket 0 (Broadcast + ARP) and Bucket 1 (Unknown UC/MC)
-
Modular Controllers; protection per Unit per Ethernet port:
- Units 0 (ET1), Units 2 (ET2): Broadcast + ARP
- Units 1 (ET1), Units 3 (ET2): Unknown UC + MC
|
Level |
Profile |
Controller |
Packet Rate |
Burst Size |
Typical Use Case |
||
|
1 |
Very High |
All |
20 pps |
4 KB (~47 frames) |
High-security or isolated networks |
||
|
2 |
High (Default) |
All |
40 pps |
8 KB (~95 frames) |
Standard industrial networks |
||
|
3 |
Low |
All |
80 pps |
16 KB (~190 frames) |
Networks with frequent legitimate broadcast traffic |
||
|
4 |
Very Low |
Built-in |
15 pps |
27 KB (~321 frames) |
Complex networks or backward compatibility |
||
|
Modular |
20 pps |
30 KB (~357 frames) |
Backward compatibility |
||||
Note: Level 4 on Modular controllers reproduces the original pre-configured behavior. Unlike other levels, it applies Broadcast-only filtering with no Unknown UC/MC protection intended for backward compatibility.